Scaling Kubernetes Pods with KEDA Beyond CPU and Memory
Learn how KEDA enables intelligent pod scaling based on application metrics instead of hardware resources, with practical examples for getting started with event-driven autoscaling.

#Introduction
Your Kubernetes cluster is running smoothly until suddenly, a queue backs up with 10,000 messages. Your pods are using only 20% CPU, so the Horizontal Pod Autoscaler (HPA) doesn't scale them. Users wait. Messages pile up. By the time CPU usage spikes enough to trigger scaling, you're already behind.
This is the fundamental problem with CPU and memory-based scaling: they're indirect metrics. They don't tell you what's actually happening in your application. A queue with 10,000 messages is a real problem, but CPU usage doesn't reflect it.
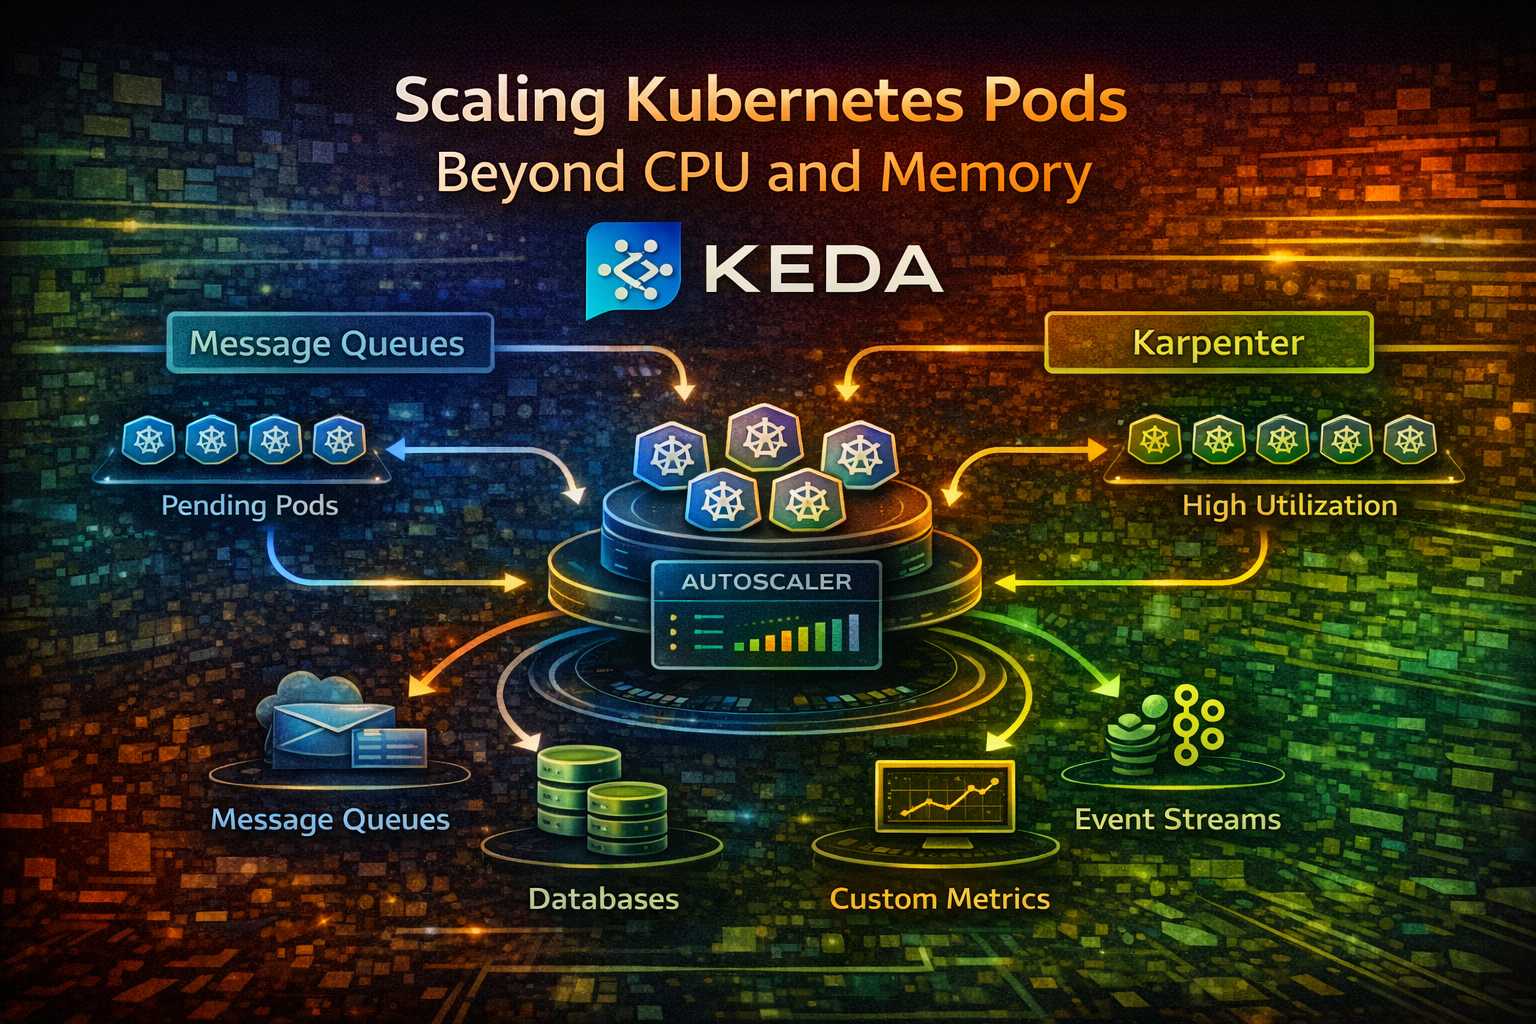
KEDA (Kubernetes Event Driven Autoscaling) solves this by letting you scale based on what actually matters: application metrics, queue depth, database connections, HTTP request rates, or any custom metric you define.
In this article, we'll explore why application-driven scaling matters, how KEDA works, and how to implement it for common scenarios.
#The Problem with CPU-Based Scaling
#Why CPU Metrics Fall Short
Kubernetes' default HPA scales based on CPU and memory usage. This works for some workloads but fails for others:
Scenario 1: Queue Processing
- Your worker pods process messages from a queue
- Queue depth: 5,000 messages
- CPU usage: 15% (pods are waiting for work, not using CPU)
- HPA decision: Don't scale (CPU is low)
- Result: Messages pile up, latency increases
Scenario 2: Batch Processing
- Your job processes files from object storage
- 1,000 files waiting to be processed
- CPU usage: 10% (I/O bound, not CPU bound)
- HPA decision: Don't scale
- Result: Files sit unprocessed for hours
Scenario 3: API Serving
- Your API handles requests efficiently
- Request rate: 10,000 req/s
- CPU usage: 30% (still under threshold)
- HPA decision: Don't scale
- Result: Latency increases, requests timeout
In all these cases, the real problem isn't CPU usage—it's workload volume. CPU is a side effect, not the cause.
#The Indirect Metric Problem
CPU and memory are indirect metrics. They tell you about resource consumption, not about actual work. Consider:
- A pod using 80% CPU might be doing useful work or spinning in a loop
- A pod using 5% CPU might be starved for resources or just efficient
- A pod using 50% CPU might need to scale or might be fine
Without understanding what the pod is actually doing, you're flying blind.
#How KEDA Works
#The KEDA Architecture
KEDA sits between your application and Kubernetes' autoscaling system. It watches external metrics (queues, databases, HTTP endpoints) and tells Kubernetes how many pods you need.
Here's the flow:
- Scaler: KEDA connects to an external system (RabbitMQ, Kafka, PostgreSQL, etc.)
- Metric Collection: The scaler queries the external system for metrics
- Desired Replica Count: KEDA calculates how many pods you need based on the metric
- HPA Integration: KEDA creates an HPA resource that scales your deployment
- Scaling: Kubernetes scales your pods up or down
KEDA supports 50+ scalers out of the box: message queues, databases, cloud services, HTTP endpoints, and more. You can also write custom scalers.
#KEDA vs Traditional HPA
Traditional HPA:
- Watches CPU/memory metrics
- Scales based on resource usage
- Works well for compute-bound workloads
- Misses application-level signals
KEDA:
- Watches application metrics
- Scales based on actual workload
- Works for any workload type
- Understands your application's needs
Think of it this way: HPA is like a thermostat that scales based on room temperature. KEDA is like a thermostat that scales based on how many people are in the room.
#Fundamental Concepts
#Scalers
A scaler is a plugin that connects to an external system and extracts metrics. KEDA includes scalers for:
- Message Queues: RabbitMQ, Kafka, AWS SQS, Azure Service Bus
- Databases: PostgreSQL, MySQL, MongoDB
- Cloud Services: AWS DynamoDB, Google Cloud Pub/Sub, Azure Queue Storage
- HTTP: Generic HTTP endpoints
- Metrics: Prometheus, Datadog, New Relic
- Custom: Write your own
Each scaler knows how to query its system and extract meaningful metrics.
#ScaledObject
A ScaledObject is a Kubernetes resource that tells KEDA how to scale a deployment. It specifies:
- Which deployment to scale
- Which scaler to use
- How to connect to the external system
- Scaling parameters (min/max replicas, target metric value)
#Triggers
A trigger is a condition that causes scaling. A ScaledObject can have multiple triggers. KEDA scales based on all triggers, using the highest desired replica count.
For example, you might scale based on both queue depth AND CPU usage. If queue depth says you need 10 pods and CPU says you need 5, KEDA scales to 10.
#Getting Started: Queue-Based Scaling
Let's implement the most common scenario: scaling workers based on queue depth.
#Setup: RabbitMQ Queue
First, deploy RabbitMQ (or use an existing instance):
apiVersion: apps/v1
kind: Deployment
metadata:
  name: rabbitmq
spec:
  replicas: 1
  selector:
    matchLabels:
      app: rabbitmq
  template:
    metadata:
      labels:
        app: rabbitmq
    spec:
      containers:
      - name: rabbitmq
        image: rabbitmq:3.12-management
        ports:
        - containerPort: 5672
          name: amqp
        - containerPort: 15672
          name: management
        env:
        - name: RABBITMQ_DEFAULT_USER
          value: guest
        - name: RABBITMQ_DEFAULT_PASS
          value: guest
---
apiVersion: v1
kind: Service
metadata:
  name: rabbitmq
spec:
  selector:
    app: rabbitmq
  ports:
  - port: 5672
    name: amqp
  - port: 15672
name: management#Install KEDA
Install KEDA using Helm:
helm repo add kedacore https://kedacore.github.io/charts
helm repo update
helm install keda kedacore/keda --namespace keda --create-namespace
Verify KEDA is running:
kubectl get pods -n keda#Deploy a Worker Application
Create a simple worker that processes messages from RabbitMQ:
apiVersion: apps/v1
kind: Deployment
metadata:
  name: queue-worker
spec:
  replicas: 1
  selector:
    matchLabels:
      app: queue-worker
  template:
    metadata:
      labels:
        app: queue-worker
    spec:
      containers:
      - name: worker
        image: myapp/queue-worker:latest
        env:
        - name: RABBITMQ_HOST
          value: rabbitmq
        - name: RABBITMQ_USER
          value: guest
        - name: RABBITMQ_PASSWORD
          value: guest
        - name: QUEUE_NAME
          value: tasks
        resources:
          requests:
            cpu: 100m
            memory: 128Mi
          limits:
            cpu: 500m
memory: 512Mi#Create a ScaledObject
Now tell KEDA to scale the worker based on queue depth:
apiVersion: keda.sh/v1alpha1
kind: ScaledObject
metadata:
  name: queue-worker-scaler
spec:
  scaleTargetRef:
    name: queue-worker
  minReplicaCount: 1
  maxReplicaCount: 10
  triggers:
  - type: rabbitmq
    metadata:
      host: amqp://guest:guest@rabbitmq:5672/
      queueName: tasks
      queueLength: "5"
This configuration:
- Scales the
queue-workerdeployment - Maintains 1-10 replicas
- Scales based on RabbitMQ queue depth
- Creates 1 new pod for every 5 messages in the queue
If the queue has 50 messages, KEDA calculates: 50 / 5 = 10 pods needed.
#Test the Scaling
Publish messages to the queue:
# Connect to RabbitMQ and publish 100 messages
kubectl exec -it deployment/rabbitmq -- \
  rabbitmq-publish \
  --uri amqp://guest:guest@localhost:5672 \
  --exchange tasks \
  --routing-key tasks \
  --count 100
Watch the pods scale:
kubectl get pods -l app=queue-worker --watchYou should see pods scale from 1 to 20 (100 messages / 5 per pod). As workers process messages and the queue empties, pods scale back down.
Tip
KEDA has a cooldown period (default 5 minutes) before scaling down. This prevents rapid scaling up and down when queue depth fluctuates.
#Practical Scenarios
#Scenario 1: HTTP Request Rate Scaling
Scale based on HTTP request rate instead of CPU:
apiVersion: keda.sh/v1alpha1
kind: ScaledObject
metadata:
  name: api-scaler
spec:
  scaleTargetRef:
    name: api-server
  minReplicaCount: 2
  maxReplicaCount: 50
  triggers:
  - type: prometheus
    metadata:
      serverAddress: http://prometheus:9090
      metricName: http_requests_per_second
      query: |
        rate(http_requests_total[1m])
      threshold: "100"
This scales your API based on request rate. If you're getting 1,000 requests/second and each pod handles 100 req/s, KEDA scales to 10 pods.
#Scenario 2: Database Connection Pool Scaling
Scale based on active database connections:
apiVersion: keda.sh/v1alpha1
kind: ScaledObject
metadata:
  name: db-worker-scaler
spec:
  scaleTargetRef:
    name: db-worker
  minReplicaCount: 1
  maxReplicaCount: 20
  triggers:
  - type: postgresql
    metadata:
      query: "SELECT COUNT(*) FROM pg_stat_activity WHERE state = 'active'"
      targetQueryValue: "10"
      connectionString: "postgresql://user:pass@postgres:5432/mydb"
This scales workers based on active database connections. If you have 100 active connections and each worker uses 10, KEDA scales to 10 pods.
#Scenario 3: Multiple Triggers
Scale based on multiple conditions:
KEDA uses the highest desired replica count from all triggers. If queue depth says 10 pods and CPU says 5, KEDA scales to 10.
#Scenario 4: Kafka Consumer Lag Scaling
Scale Kafka consumers based on consumer lag:
apiVersion: keda.sh/v1alpha1
kind: ScaledObject
metadata:
  name: kafka-consumer-scaler
spec:
  scaleTargetRef:
    name: kafka-consumer
  minReplicaCount: 1
  maxReplicaCount: 20
  triggers:
  - type: kafka
    metadata:
      bootstrapServers: kafka:9092
      consumerGroup: my-consumer-group
      topic: events
      lagThreshold: "100"
This scales consumers based on how far behind they are. If lag is 1,000 messages and threshold is 100, KEDA scales to 10 pods.
#Advanced Configuration
#Scaling Behavior
Control how aggressively KEDA scales:
apiVersion: keda.sh/v1alpha1
kind: ScaledObject
metadata:
  name: worker-scaler
spec:
  scaleTargetRef:
    name: worker
  minReplicaCount: 1
  maxReplicaCount: 50
  triggers:
  - type: rabbitmq
    metadata:
      host: amqp://guest:guest@rabbitmq:5672/
      queueName: tasks
      queueLength: "5"
  # Scale up aggressively
  behavior:
    scaleUp:
      stabilizationWindowSeconds: 0
      policies:
      - type: Percent
        value: 100
        periodSeconds: 15
    # Scale down conservatively
    scaleDown:
      stabilizationWindowSeconds: 300
      policies:
      - type: Percent
        value: 50
        periodSeconds: 60
This configuration:
- Scales up immediately (0 second stabilization)
- Doubles pods every 15 seconds if needed
- Scales down slowly (5 minute stabilization)
- Reduces pods by 50% every 60 seconds
This prevents rapid scaling up and down while still responding quickly to load increases.
#Fallback Scaling
If the external metric is unavailable, fall back to CPU scaling:
apiVersion: keda.sh/v1alpha1
kind: ScaledObject
metadata:
  name: worker-scaler
spec:
  scaleTargetRef:
    name: worker
  minReplicaCount: 1
  maxReplicaCount: 50
  triggers:
  - type: rabbitmq
    metadata:
      host: amqp://guest:guest@rabbitmq:5672/
      queueName: tasks
      queueLength: "5"
  # Fallback to CPU if RabbitMQ is down
  - type: cpu
    metricType: Utilization
    metadata:
      value: "70"
If RabbitMQ becomes unavailable, KEDA falls back to CPU-based scaling. Your application keeps running.
#Common Mistakes and Pitfalls
#Mistake 1: Setting Target Metric Too High
If you set queueLength: "100", KEDA waits until 100 messages pile up before scaling. This causes latency spikes.
Better: Set it to the number of messages one pod can process in 1-2 minutes. If a pod processes 10 messages/minute, set queueLength: "20".
#Mistake 2: Not Setting Min Replicas
If minReplicaCount: 0, KEDA scales to zero pods when the queue is empty. When new messages arrive, it takes time to start pods and process them.
Better: Set minReplicaCount: 1 to keep at least one pod running. The cost is minimal compared to latency spikes.
#Mistake 3: Ignoring Cooldown Periods
KEDA has default cooldown periods (5 minutes for scale-down). If your queue fluctuates rapidly, pods might not scale down quickly.
Better: Understand the cooldown periods and adjust them based on your workload. For rapidly fluctuating loads, reduce cooldown. For stable loads, increase it.
#Mistake 4: Not Monitoring KEDA Itself
KEDA is another component that can fail. If KEDA crashes, scaling stops.
Better: Monitor KEDA's health, set up alerts, and ensure it's highly available.
#Mistake 5: Mixing Incompatible Triggers
Some triggers don't work well together. For example, scaling based on both queue depth and CPU can cause unexpected behavior.
Better: Understand how triggers interact. Use multiple triggers only when they measure different dimensions of load.
#Best Practices
#1. Start with One Metric
Don't try to scale based on five metrics at once. Start with the most important one (queue depth, request rate, etc.), get it working, then add others.
#2. Set Realistic Target Values
The target value should represent the workload one pod can handle. If a pod can process 10 messages/second, set the target to 10-20 (accounting for some buffer).
#3. Monitor Scaling Decisions
KEDA exports metrics to Prometheus. Monitor them:
# Current desired replicas
keda_scaler_active_count

# Metric value from scaler
keda_scaler_metrics_value

# Scaling errors
keda_scaler_errors_total#4. Test Scaling Behavior
Before deploying to production, test how your application scales:
- Gradually increase load and watch pods scale
- Decrease load and watch pods scale down
- Simulate metric unavailability and verify fallback works
#5. Use Appropriate Cooldown Periods
- Scale-up cooldown: Keep short (0-30 seconds) to respond quickly to load
- Scale-down cooldown: Keep long (5-10 minutes) to avoid rapid scaling
#6. Combine with Resource Requests/Limits
KEDA scales the number of pods, but each pod still needs resource requests and limits. Set these appropriately:
resources:
  requests:
    cpu: 100m
    memory: 128Mi
  limits:
    cpu: 500m
    memory: 512Mi
This ensures your cluster has enough capacity for scaled pods.
#7. Plan for Cluster Capacity
If KEDA scales to 50 pods and your cluster only has capacity for 30, pods will be pending. Monitor cluster capacity and scale your cluster accordingly.
#When NOT to Use KEDA
#KEDA Isn't Ideal When:
- You have simple, predictable workloads: CPU-based scaling works fine
- You need sub-second scaling: KEDA has polling intervals (default 30 seconds)
- Your external metric system is unreliable: If the metric source is down frequently, KEDA can't scale
- You're scaling based on custom business logic: KEDA scalers are predefined; complex logic might need custom solutions
#Conclusion
KEDA transforms how you scale Kubernetes workloads. Instead of waiting for CPU to spike, you scale based on what actually matters: queue depth, request rate, database connections, or any metric you define.
The fundamental insight: scale based on work, not resources. A queue with 1,000 messages is a real problem, even if CPU is low. KEDA lets you respond to actual workload, not indirect signals.
Start with queue-based scaling for background workers. Add HTTP request rate scaling for APIs. Combine multiple triggers for complex workloads. Monitor everything and adjust based on real-world behavior.
Your applications will be more responsive, your users will be happier, and your infrastructure will be more efficient.
#Next Steps
- Install KEDA in your Kubernetes cluster
- Identify your most important metric: Queue depth, request rate, database connections, etc.
- Deploy a ScaledObject for one workload
- Test scaling behavior by increasing and decreasing load
- Monitor KEDA metrics and adjust target values
- Expand to other workloads as you gain confidence
Start simple, test thoroughly, and scale intelligently.