Learning Kubernetes - Introduction and Explanation of Kubernetes Dashboard
In this episode, we'll discuss Kubernetes Dashboard for managing clusters through a web UI. We'll learn how to install Dashboard v2.7.0, create admin users, access the dashboard, and best practices for secure dashboard deployment.

#Introduction
In the previous episode, we learned about StatefulSet for managing stateful applications with stable identities and persistent storage. In episode 28, we'll discuss Kubernetes Dashboard, a web-based UI for managing and monitoring your Kubernetes cluster.
Note: Here I'll be using a Kubernetes Cluster installed through K3s.
While kubectl is powerful for command-line management, Kubernetes Dashboard provides a visual interface for viewing cluster resources, deploying applications, troubleshooting issues, and monitoring workloads - making cluster management more accessible.
#What Is Kubernetes Dashboard?
Kubernetes Dashboard is a general-purpose, web-based UI for Kubernetes clusters. It allows users to manage applications running in the cluster, troubleshoot applications, and manage cluster resources.
Think of Dashboard like a control panel for your cluster - instead of typing commands, you can click through resources, view logs, edit configurations, and monitor health through an intuitive interface.
Key features of Kubernetes Dashboard:
- Resource visualization - View all cluster resources in one place
- Application deployment - Deploy containerized applications via UI
- Troubleshooting - View logs, events, and resource status
- Resource management - Create, edit, delete resources
- Monitoring - View CPU/memory usage and metrics
- RBAC integration - Respects Kubernetes permissions
- Multi-namespace - Switch between namespaces easily
- Real-time updates - Live view of cluster state
#Why Use Kubernetes Dashboard?
Dashboard solves several challenges:
- Visual management - Easier than memorizing kubectl commands
- Quick troubleshooting - View logs and events in one place
- Team accessibility - Non-CLI users can manage clusters
- Resource discovery - Browse all resources visually
- Rapid deployment - Deploy apps without writing YAML
- Monitoring - Quick overview of cluster health
- Learning tool - Understand Kubernetes structure visually
- Audit trail - See what's running in your cluster
Without Dashboard, you rely entirely on kubectl, which can be challenging for beginners or teams preferring visual interfaces.
#Installing Kubernetes Dashboard v2.7.0
Let's install Dashboard v2.7.0 step by step.
#Step 1: Deploy Dashboard
Apply the official Dashboard manifest:
kubectl apply -f https://raw.githubusercontent.com/kubernetes/dashboard/v2.7.0/aio/deploy/recommended.yamlThis creates:
- Namespace:
kubernetes-dashboard - ServiceAccount, Secret, ConfigMap
- Deployment:
kubernetes-dashboard - Service:
kubernetes-dashboard - RBAC roles and bindings
#Step 2: Verify Installation
Check Dashboard pods:
kubectl get pods -n kubernetes-dashboardOutput:
NAME                                         READY   STATUS    RESTARTS   AGE
dashboard-metrics-scraper-5cb4f4bb9c-xxxxx   1/1     Running   0          1m
kubernetes-dashboard-79cbcf9fb6-xxxxx        1/1     Running   0          1m
Check Dashboard service:
kubectl get svc -n kubernetes-dashboardOutput:
NAME                        TYPE        CLUSTER-IP      EXTERNAL-IP   PORT(S)    AGE
dashboard-metrics-scraper   ClusterIP   10.43.xxx.xxx   <none>        8000/TCP   1m
kubernetes-dashboard ClusterIP 10.43.xxx.xxx <none> 443/TCP 1m#Step 3: Create Admin User
Dashboard requires authentication. Create a ServiceAccount with admin privileges.
Create dashboard-admin.yml:
apiVersion: v1
kind: ServiceAccount
metadata:
    name: admin-user
    namespace: kubernetes-dashboard
---
apiVersion: rbac.authorization.k8s.io/v1
kind: ClusterRoleBinding
metadata:
    name: admin-user
roleRef:
    apiGroup: rbac.authorization.k8s.io
    kind: ClusterRole
    name: cluster-admin
subjects:
    - kind: ServiceAccount
      name: admin-user
      namespace: kubernetes-dashboard
Apply the configuration:
kubectl apply -f dashboard-admin.ymlWarning
Security Warning: This creates a user with cluster-admin privileges. For production, use more restrictive RBAC roles.
#Step 4: Generate Access Token
Create a token for the admin user:
kubectl -n kubernetes-dashboard create token admin-userOutput (example):
eyJhbGciOiJSUzI1NiIsImtpZCI6IjRxN3Z...very-long-token...xyz123Copy this token - you'll need it to log in to Dashboard.
Note
Tokens created with create token are short-lived (default 1 hour). For long-lived tokens, create a Secret manually.
#Step 5: Access Dashboard
There are several ways to access Dashboard:
#Option 1: kubectl port-forward (Recommended for Development)
Forward Dashboard service to localhost:
kubectl -n kubernetes-dashboard port-forward svc/kubernetes-dashboard 8443:443Access Dashboard at: https://localhost:8443
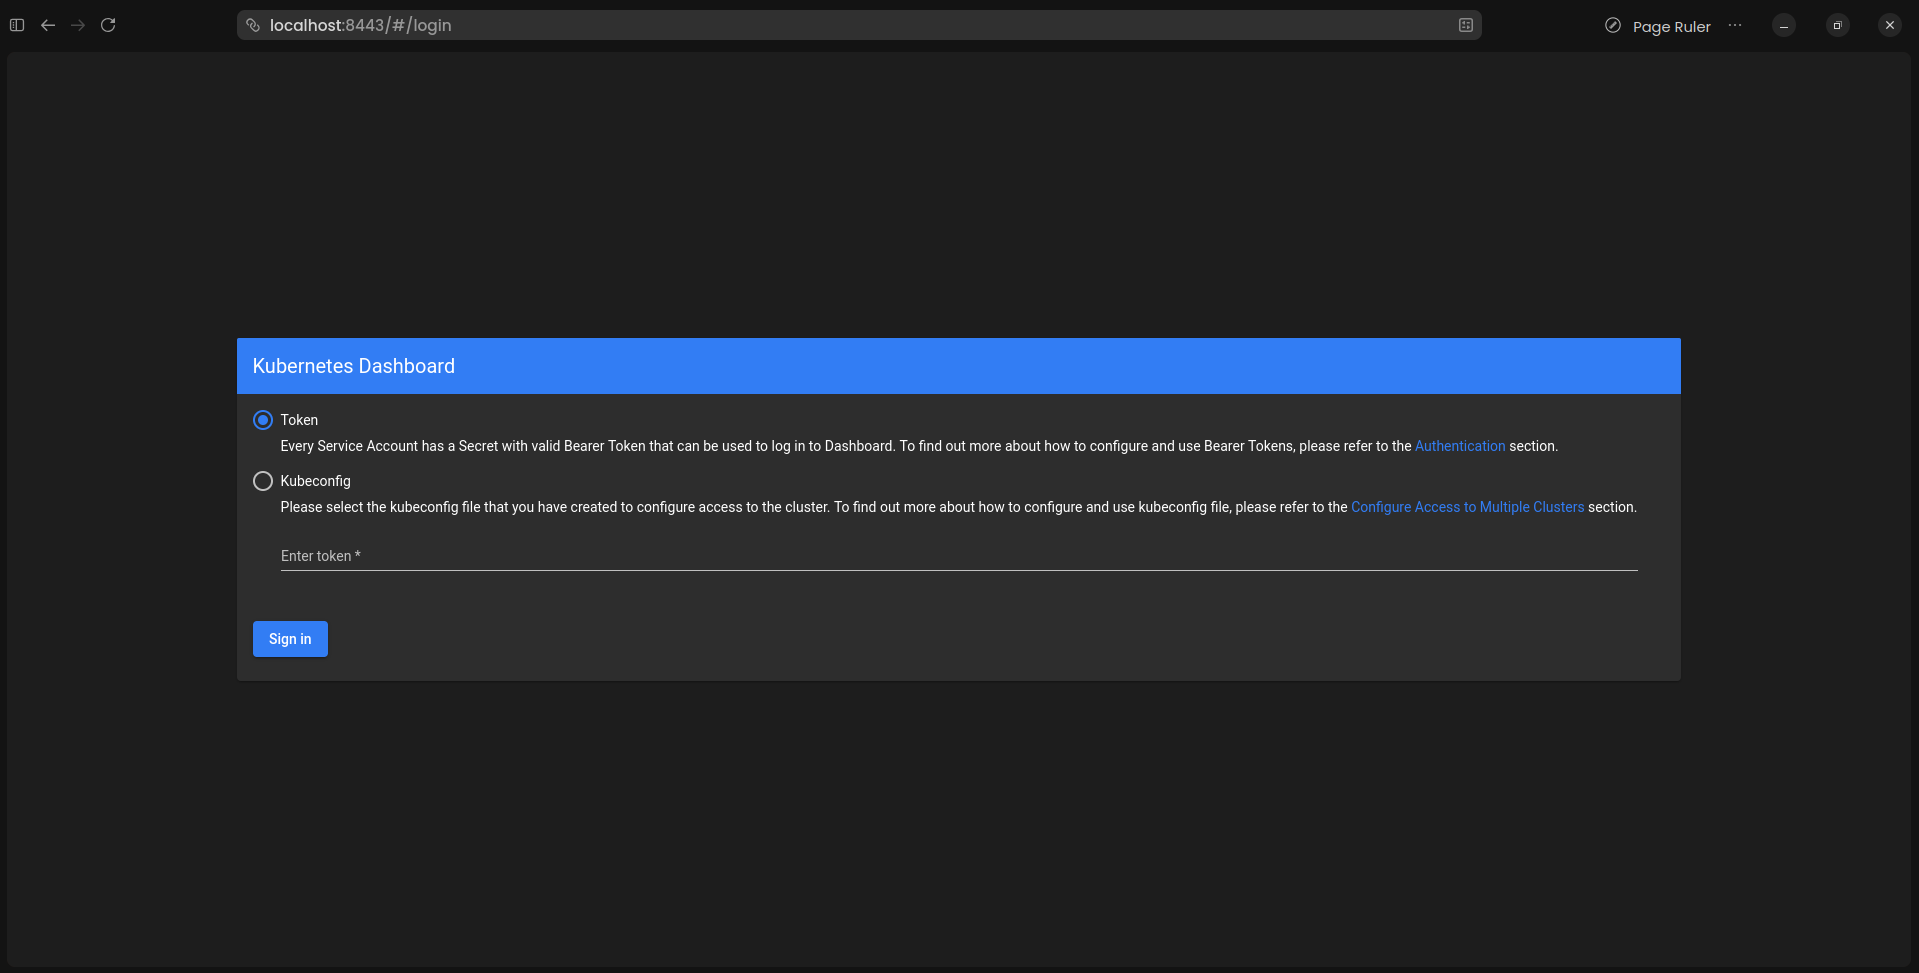 Kubernetes Dashboard Login
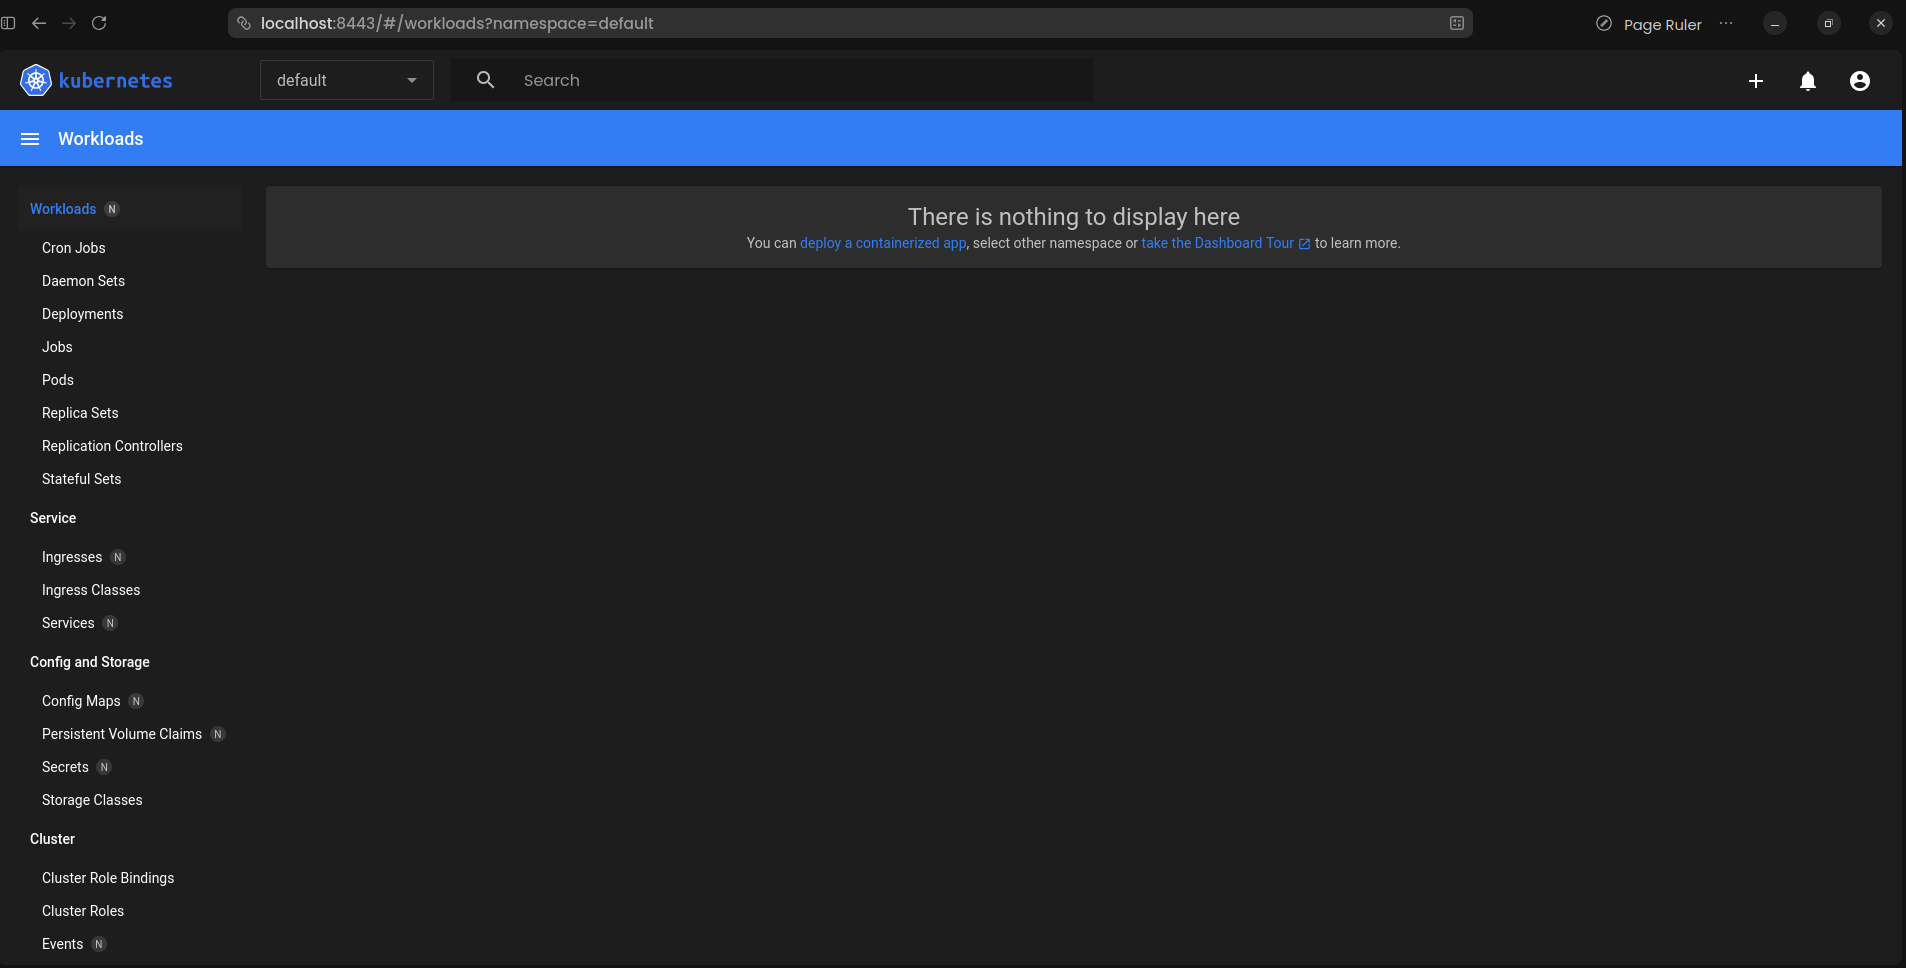 Kubernetes Dashboard Workload
#Option 2: Edit Service to NodePort
Edit the Dashboard service:
kubectl edit svc kubernetes-dashboard -n kubernetes-dashboardChange type: ClusterIP to type: NodePort:
spec:
    type: NodePort  # Changed from ClusterIP
    ports:
        - port: 443
          targetPort: 8443
          nodePort: 30443  # Optional: specify port
Get the NodePort:
kubectl get svc -n kubernetes-dashboardAccess Dashboard at: https://<node-ip>:<node-port>
#Option 3: Ingress (Recommended for Production)
Create an Ingress resource:
apiVersion: networking.k8s.io/v1
kind: Ingress
metadata:
    name: kubernetes-dashboard
    namespace: kubernetes-dashboard
    annotations:
        nginx.ingress.kubernetes.io/backend-protocol: "HTTPS"
        nginx.ingress.kubernetes.io/ssl-redirect: "true"
spec:
    ingressClassName: nginx
    tls:
        - hosts:
              - dashboard.example.com
          secretName: dashboard-tls
    rules:
        - host: dashboard.example.com
          http:
              paths:
                  - path: /
                    pathType: Prefix
                    backend:
                        service:
                            name: kubernetes-dashboard
                            port:
number: 443#Step 6: Login to Dashboard
- Open Dashboard URL in browser
- You'll see a certificate warning (self-signed cert) - accept it
- Select "Token" authentication method
- Paste the token from Step 4
- Click "Sign in"
You're now logged in to Kubernetes Dashboard!
#Dashboard Overview
#Main Sections
Cluster:
- Nodes - View cluster nodes
- Namespaces - Browse namespaces
- Persistent Volumes - Manage storage
- Roles - View RBAC roles
- Storage Classes - View storage classes
Workloads:
- Deployments - Manage deployments
- Pods - View and manage pods
- ReplicaSets - View replica sets
- StatefulSets - Manage stateful apps
- DaemonSets - View daemon sets
- Jobs - View jobs
- CronJobs - Manage scheduled jobs
Service:
- Services - View services
- Ingresses - Manage ingress rules
- Network Policies - View network policies
Config and Storage:
- ConfigMaps - Manage configuration
- Secrets - View secrets (values hidden)
- PersistentVolumeClaims - Manage PVCs
Custom Resources:
- Custom Resource Definitions - View CRDs
#Using Dashboard
#Viewing Resources
Navigate to any resource type:
- Click on resource type in sidebar (e.g., "Pods")
- Select namespace from dropdown
- View list of resources
- Click resource name for details
#Viewing Pod Details
- Navigate to Workloads → Pods
- Click pod name
- View:
- Pod status and conditions
- Container information
- Events
- Logs (click "Logs" button)
- YAML definition
#Viewing Logs
- Navigate to pod details
- Click "Logs" icon
- Select container (if multi-container)
- View real-time logs
- Use search and download features
#Deploying Applications
- Click "+" icon (top right)
- Choose method:
- Create from input (paste YAML)
- Create from file (upload YAML)
- Create from form (fill fields)
- Enter configuration
- Click "Deploy"
Example form deployment:
App name: nginx-app
Container image: nginx:1.25
Number of pods: 3
Service: External (NodePort)
Port: 80
Target port: 80#Editing Resources
- Navigate to resource
- Click resource name
- Click "Edit" icon (pencil)
- Modify YAML
- Click "Update"
#Deleting Resources
- Navigate to resource
- Check checkbox next to resource
- Click "Delete" icon (trash)
- Confirm deletion
#Scaling Deployments
- Navigate to Deployments
- Click deployment name
- Click "Scale" icon
- Enter desired replicas
- Click "Scale"
#Executing Commands in Pods
- Navigate to pod details
- Click "Exec" icon (terminal)
- Select container
- Execute commands in shell
#Creating Long-Lived Token
For persistent access, create a Secret-based token.
#Create Secret for ServiceAccount
apiVersion: v1
kind: Secret
metadata:
    name: admin-user-token
    namespace: kubernetes-dashboard
    annotations:
        kubernetes.io/service-account.name: admin-user
type: kubernetes.io/service-account-token
Apply:
kubectl apply -f admin-user-secret.yml#Get Token from Secret
kubectl get secret admin-user-token -n kubernetes-dashboard -o jsonpath="{.data.token}" | base64 --decodeThis token doesn't expire and can be used for long-term access.
#Creating Read-Only User
For users who should only view resources:
apiVersion: v1
kind: ServiceAccount
metadata:
    name: readonly-user
    namespace: kubernetes-dashboard
---
apiVersion: rbac.authorization.k8s.io/v1
kind: ClusterRoleBinding
metadata:
    name: readonly-user
roleRef:
    apiGroup: rbac.authorization.k8s.io
    kind: ClusterRole
    name: view
subjects:
    - kind: ServiceAccount
      name: readonly-user
      namespace: kubernetes-dashboard
Apply:
kubectl apply -f dashboard-readonly.ymlGenerate token:
kubectl -n kubernetes-dashboard create token readonly-user#Creating Namespace-Specific User
For users limited to specific namespace:
apiVersion: v1
kind: ServiceAccount
metadata:
    name: dev-user
    namespace: kubernetes-dashboard
---
apiVersion: rbac.authorization.k8s.io/v1
kind: RoleBinding
metadata:
    name: dev-user
    namespace: development
roleRef:
    apiGroup: rbac.authorization.k8s.io
    kind: ClusterRole
    name: edit
subjects:
    - kind: ServiceAccount
      name: dev-user
      namespace: kubernetes-dashboard
This user can only access the development namespace.
#Troubleshooting Dashboard
#Dashboard Pod Not Running
Check pod status:
kubectl get pods -n kubernetes-dashboardView pod logs:
kubectl logs -n kubernetes-dashboard deployment/kubernetes-dashboardDescribe pod:
kubectl describe pod -n kubernetes-dashboard <pod-name>#Cannot Access Dashboard
Check service:
kubectl get svc -n kubernetes-dashboard
kubectl describe svc kubernetes-dashboard -n kubernetes-dashboard
Verify port-forward is running:
kubectl -n kubernetes-dashboard port-forward svc/kubernetes-dashboard 8443:443#Token Authentication Failed
Verify ServiceAccount exists:
kubectl get sa admin-user -n kubernetes-dashboardVerify ClusterRoleBinding:
kubectl get clusterrolebinding admin-userGenerate new token:
kubectl -n kubernetes-dashboard create token admin-user#Certificate Errors
Dashboard uses self-signed certificates by default. For production:
- Create proper TLS certificate
- Create Secret with certificate
- Update Dashboard deployment to use certificate
apiVersion: v1
kind: Secret
metadata:
    name: kubernetes-dashboard-certs
    namespace: kubernetes-dashboard
type: kubernetes.io/tls
data:
    tls.crt: <base64-encoded-cert>
tls.key: <base64-encoded-key>#Common Mistakes and Pitfalls
#Mistake 1: Using cluster-admin for All Users
Problem: Giving everyone full cluster access.
Solution: Create role-specific users:
# Read-only user
roleRef:
    kind: ClusterRole
    name: view

# Edit user (no delete)
roleRef:
    kind: ClusterRole
name: edit#Mistake 2: Exposing Dashboard Publicly Without Authentication
Problem: Dashboard accessible from internet without proper security.
Solution: Use one of these approaches:
- Keep Dashboard internal-only
- Use VPN for access
- Implement additional authentication (OAuth2 proxy)
- Use Ingress with authentication
#Mistake 3: Not Setting Resource Limits
Problem: Dashboard pods can consume unlimited resources.
Solution: Edit deployment to add limits:
kubectl edit deployment kubernetes-dashboard -n kubernetes-dashboardAdd:
resources:
    requests:
        memory: "128Mi"
        cpu: "100m"
    limits:
        memory: "256Mi"
cpu: "200m"#Mistake 4: Using Short-Lived Tokens in Automation
Problem: Tokens expire after 1 hour.
Solution: Create Secret-based tokens for automation:
apiVersion: v1
kind: Secret
metadata:
    name: admin-user-token
    annotations:
        kubernetes.io/service-account.name: admin-user
type: kubernetes.io/service-account-token#Mistake 5: Not Monitoring Dashboard Access
Problem: No audit trail of Dashboard usage.
Solution: Enable audit logging in Kubernetes API server and monitor Dashboard access patterns.
#Best Practices
#Secure Access
Use strong authentication:
# Minimum privileges principle
roleRef:
    kind: ClusterRole
name: view # Not cluster-admin#Use Ingress with TLS
Secure Dashboard with proper certificates:
spec:
    tls:
        - hosts:
              - dashboard.example.com
secretName: dashboard-tls-cert#Implement Network Policies
Restrict Dashboard network access:
apiVersion: networking.k8s.io/v1
kind: NetworkPolicy
metadata:
    name: dashboard-access
    namespace: kubernetes-dashboard
spec:
    podSelector:
        matchLabels:
            k8s-app: kubernetes-dashboard
    policyTypes:
        - Ingress
    ingress:
        - from:
              - namespaceSelector:
                    matchLabels:
                        name: ingress-nginx
          ports:
              - protocol: TCP
port: 8443#Set Resource Limits
Prevent resource exhaustion:
resources:
    requests:
        memory: "128Mi"
        cpu: "100m"
    limits:
        memory: "256Mi"
cpu: "200m"#Use RBAC Properly
Create role-specific users:
# Admin user - full access
# Developer user - namespace-specific
# Viewer user - read-only#Regular Token Rotation
Rotate tokens periodically:
# Delete old token
kubectl delete secret admin-user-token -n kubernetes-dashboard

# Create new token
kubectl apply -f admin-user-secret.yml#Monitor Dashboard Usage
Track who accesses Dashboard and what they do:
kubectl logs -n kubernetes-dashboard deployment/kubernetes-dashboard#Keep Dashboard Updated
Regularly update to latest version:
kubectl apply -f https://raw.githubusercontent.com/kubernetes/dashboard/v2.7.0/aio/deploy/recommended.yaml#Dashboard Alternatives
While Dashboard is official, consider alternatives:
Lens:
- Desktop application
- Multi-cluster management
- Built-in terminal
- Prometheus integration
K9s:
- Terminal-based UI
- Keyboard-driven
- Real-time updates
- Resource management
Octant:
- Local web UI
- Plugin system
- Resource visualization
- Developer-focused
Rancher:
- Full platform
- Multi-cluster
- CI/CD integration
- User management
#Viewing Dashboard Details
#Get Dashboard Resources
kubectl get all -n kubernetes-dashboard#Check Dashboard Version
kubectl get deployment kubernetes-dashboard -n kubernetes-dashboard -o jsonpath="{.spec.template.spec.containers[0].image}"#View Dashboard Logs
kubectl logs -n kubernetes-dashboard deployment/kubernetes-dashboard -f#Check Dashboard Service
kubectl describe svc kubernetes-dashboard -n kubernetes-dashboard#Uninstalling Dashboard
#Delete Dashboard
kubectl delete -f https://raw.githubusercontent.com/kubernetes/dashboard/v2.7.0/aio/deploy/recommended.yaml#Delete Admin User
kubectl delete -f dashboard-admin.yml#Delete Namespace
kubectl delete namespace kubernetes-dashboard#Conclusion
In episode 28, we've explored Kubernetes Dashboard in depth. We've learned how to install Dashboard v2.7.0, create admin users, access the dashboard securely, and manage cluster resources through a web interface.
Key takeaways:
- Dashboard provides web-based UI for Kubernetes management
- Install with single
kubectl applycommand - Requires authentication via token or kubeconfig
- Create ServiceAccount with appropriate RBAC permissions
- Access via port-forward, NodePort, or Ingress
- cluster-admin role gives full access (use carefully)
- view role provides read-only access
- edit role allows modifications without delete
- Create long-lived tokens using Secret
- Use namespace-specific roles for limited access
- Always use TLS for production deployments
- Implement Network Policies to restrict access
- Set resource limits on Dashboard pods
- Monitor Dashboard access and usage
- Consider alternatives like Lens, K9s, Octant
- Keep Dashboard updated to latest version
Kubernetes Dashboard makes cluster management accessible through an intuitive web interface. By understanding Dashboard installation and security best practices, you can provide your team with visual cluster management while maintaining proper access controls.
Are you getting a clearer understanding of Kubernetes Dashboard? Keep your learning momentum going and look forward to the next episode!