Observability vs Monitoring - Building Production-Grade Visibility
Understand the critical difference between monitoring and observability. Learn how to instrument your systems for true observability, handle unknown unknowns, and build visibility that scales with your infrastructure complexity.

#Introduction
Your production system is down. Users can't log in. Your monitoring dashboard shows everything green. Your alerts didn't fire. You're staring at metrics that tell you nothing about what's actually broken.
This is the difference between monitoring and observability.
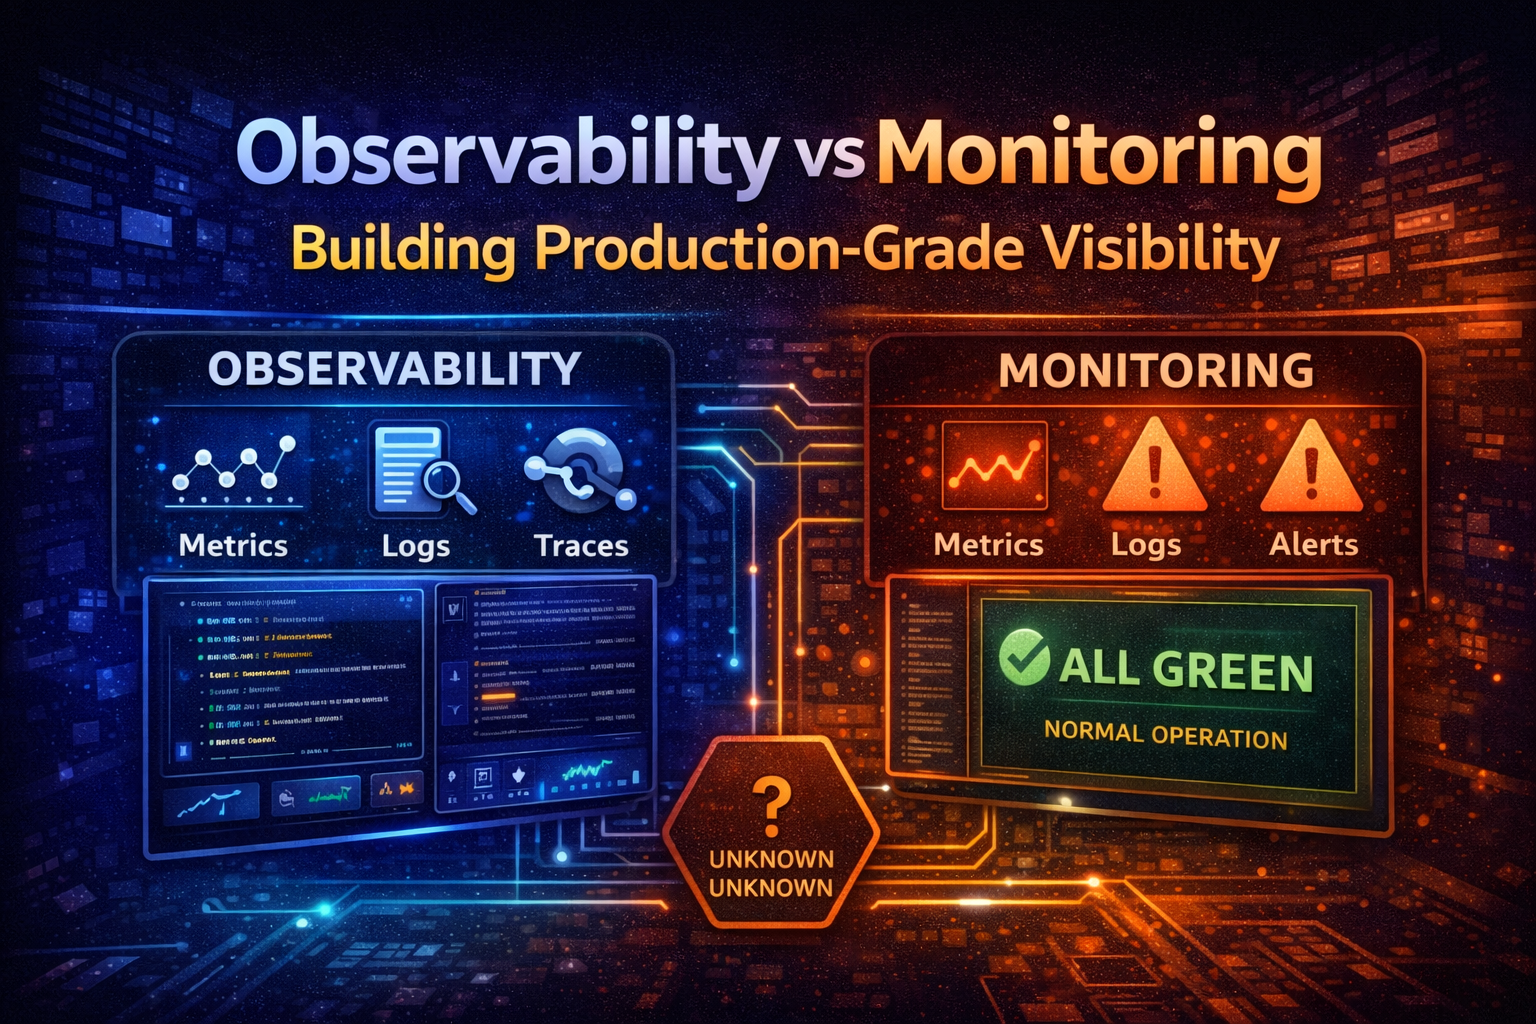
Monitoring tells you what you already know to look for. Observability lets you ask any question about your system without predicting what might go wrong. In today's distributed systems, microservices, and cloud infrastructure, monitoring alone isn't enough. You need observability.
The distinction matters because it changes how you instrument your code, what data you collect, and ultimately whether you can debug production issues in minutes or hours. This guide explains the difference, why it matters, and how to build observability into your systems from day one.
#Monitoring vs Observability: The Core Difference
#What Monitoring Actually Is
Monitoring is about collecting predefined metrics and checking them against thresholds. You decide in advance what matters: CPU usage, memory, request latency, error rates. You set up dashboards and alerts for these metrics. When something crosses a threshold, you get paged.
Monitoring works well for simple systems with predictable failure modes. If your application is a monolith running on a few servers, you know what to monitor: CPU, disk, network, application response time.
But monitoring has a fundamental limitation: it only tells you about the things you thought to measure. If your system fails in a way you didn't anticipate, your monitoring won't catch it.
#What Observability Actually Is
Observability is the ability to understand the internal state of your system by examining its outputs. It's not about collecting specific metrics—it's about collecting enough structured data that you can ask arbitrary questions about what happened, without having predicted those questions in advance.
The term comes from control theory. A system is observable if you can determine its internal state from its external outputs. In software, this means you can debug any issue by querying your telemetry data, even if you never anticipated that specific problem.
Observability is built on three pillars:
Metrics are numerical measurements over time. Request latency, error count, CPU usage. Metrics are aggregated and efficient to store.
Logs are discrete events with context. "User 12345 logged in from 192.168.1.1" or "Database query took 2.3 seconds". Logs are detailed but expensive to store at scale.
Traces follow a request through your entire system. When a user makes a request, a trace captures every service it touches, every database query, every cache lookup. Traces show you the path and timing of work flowing through your system.
Together, these three pillars let you answer questions you didn't anticipate. Why is this specific user experiencing slow requests? Which service is the bottleneck? Why did this batch job fail halfway through?
#The Real-World Difference
Imagine a payment processing system. Your monitoring dashboard shows:
- API response time: 150ms (normal)
- Error rate: 0.1% (normal)
- Database CPU: 45% (normal)
- All alerts: green
But users report that payments are failing. Your monitoring says everything is fine. This is the monitoring trap.
With observability, you can ask: "Show me all failed payment requests in the last 5 minutes." You trace one request and see it hit the payment service, which called the fraud detection service, which timed out waiting for a third-party API. The third-party API was slow, but not slow enough to trigger your error rate alert (only 0.1% of requests hit it). Your monitoring missed it because you didn't think to alert on third-party API latency.
With observability, you would have seen this immediately because you're collecting traces that show the full request path and timing.
#Why Observability Matters at Scale
#The Complexity Problem
As your system grows, the number of potential failure modes grows exponentially. A monolith has maybe 10 things that can go wrong. A microservices system with 50 services has thousands of potential failure combinations.
You can't monitor your way out of this. You can't predict every possible failure mode and set up an alert for it. You'd end up with thousands of alerts, most of which would be noise.
Observability flips the problem. Instead of predicting what might go wrong, you collect rich data about everything that happens. When something does go wrong, you have the data to investigate it.
#The Unknown Unknowns
Monitoring handles known unknowns: "We know CPU might spike, so we'll alert on it." But production systems fail in ways you didn't anticipate. A library you depend on has a memory leak. A cloud provider has a regional outage affecting your specific availability zone. A race condition only manifests under specific load patterns.
These are unknown unknowns. You can't monitor for them because you don't know they exist. But with observability, when they happen, you have the data to figure out what went wrong.
#The Debugging Speed Problem
When your system breaks, time matters. Every minute of downtime costs money and erodes user trust. With monitoring, you're limited to the questions you anticipated. You might spend 30 minutes just figuring out which service is broken, then another 30 minutes understanding why.
With observability, you can immediately see the full request path, identify the failing service, and see exactly what went wrong. You're not limited to predefined dashboards—you can query your data in real-time to answer any question.
#The Three Pillars of Observability
#Metrics: The Aggregated View
Metrics are time-series data: a value measured at a point in time. They're efficient to store and query, which is why they're the foundation of most monitoring systems.
Good metrics are:
Dimensional. They have labels or tags that let you slice and dice the data. Instead of just "request latency," you have "request latency by service, by endpoint, by status code." This lets you drill down into problems.
Aggregated. Metrics are typically aggregated over time windows (1-minute averages, 5-minute percentiles). This makes them efficient to store and query.
Actionable. A good metric tells you something about system health. "Requests per second" is useful. "Number of times the garbage collector ran" is less useful unless you're specifically debugging GC issues.
Common metrics include:
- Request rate (requests per second)
- Request latency (p50, p95, p99 percentiles)
- Error rate (errors per second or percentage)
- Resource utilization (CPU, memory, disk, network)
- Business metrics (transactions processed, revenue, user signups)
The key is collecting metrics with enough dimensions that you can drill down into problems. If you only have "request latency," you can't tell if the problem is in your API, your database, or your cache. If you have "request latency by service," you can immediately identify the bottleneck.
#Logs: The Detailed Record
Logs are discrete events with context. They're the most detailed form of telemetry but also the most expensive to store and query at scale.
Structured logs are essential for observability. Instead of writing:
ERROR: Database connection failedWrite:
{
  "timestamp": "2026-02-10T14:23:45Z",
  "level": "ERROR",
  "service": "payment-api",
  "message": "Database connection failed",
  "error": "connection timeout",
  "database_host": "db.prod.internal",
  "database_port": 5432,
  "timeout_ms": 5000,
  "retry_count": 3,
  "user_id": "user_12345",
  "request_id": "req_abc123"
}
Structured logs let you query by any field. You can ask: "Show me all database connection failures in the last hour" or "Show me all errors for user_12345" or "Show me all timeouts on db.prod.internal."
The request_id is critical. It ties this log entry to a specific request, which lets you correlate logs across multiple services.
#Traces: The Request Journey
Traces follow a single request through your entire system. When a user makes a request, a trace captures:
- Every service the request touches
- Every database query
- Every cache lookup
- Every external API call
- The timing of each operation
- Any errors that occurred
A trace is a tree of "spans." Each span represents a unit of work. A span might be "call the payment service" or "query the database" or "call the fraud detection API."
Here's what a trace might look like for a payment request:
Request: POST /api/payments
├─ Span: Authenticate user (5ms)
├─ Span: Validate payment (12ms)
├─ Span: Call fraud detection service (450ms)
│  ├─ Span: Query fraud database (200ms)
│  └─ Span: Call ML model (240ms)
├─ Span: Process payment (180ms)
│  ├─ Span: Debit account (50ms)
│  └─ Span: Credit account (120ms)
└─ Span: Send confirmation email (2ms)
Total: 649ms
From this trace, you can immediately see that the fraud detection service is the bottleneck (450ms out of 649ms). If the request was slow, you know exactly where to investigate.
Traces are expensive to store (you can't store every trace for every request), but they're invaluable for debugging. Most observability platforms sample traces: they store 100% of errors and slow requests, but only 1% of normal requests.
#Instrumenting Your Code for Observability
#Metrics Instrumentation
Most languages have libraries for emitting metrics. Here's a practical example in Go:
import "github.com/prometheus/client_golang/prometheus"

// Define a metric
requestDuration := prometheus.NewHistogramVec(
  prometheus.HistogramOpts{
    Name: "http_request_duration_seconds",
    Help: "HTTP request latency in seconds",
    Buckets: []float64{.001, .01, .1, 1, 10},
  },
  []string{"service", "endpoint", "status"},
)

// Record a metric
timer := prometheus.NewTimer(requestDuration.WithLabelValues(
  "payment-api",
  "/api/payments",
  "200",
))
defer timer.ObserveDuration()

// Your request handling code here
The key is using labels (dimensions) to make your metrics queryable. Instead of one "request duration" metric, you have request duration broken down by service, endpoint, and status code.
#Structured Logging
Use a structured logging library that outputs JSON:
import "go.uber.org/zap"

logger, _ := zap.NewProduction()
defer logger.Sync()

logger.Info("payment processed",
  zap.String("user_id", "user_12345"),
  zap.String("request_id", "req_abc123"),
  zap.Float64("amount", 99.99),
  zap.String("status", "success"),
  zap.Duration("processing_time", 150*time.Millisecond),
)
Every log entry should include a request_id that ties it to a specific request. This lets you correlate logs across services.
#Distributed Tracing
Distributed tracing requires instrumenting your code to create spans and propagate trace context across service boundaries.
Here's a practical example using OpenTelemetry, the industry standard:
The key is that trace context is automatically propagated across service boundaries. When you make an HTTP request, the trace ID is included in the headers. The receiving service reads it and continues the trace.
#Choosing an Observability Platform
#Self-Hosted Options
Prometheus + Grafana is the most popular open-source metrics stack. Prometheus scrapes metrics from your applications, Grafana visualizes them. It's free but requires operational overhead.
ELK Stack (Elasticsearch, Logstash, Kibana) handles logs. It's powerful but complex to operate at scale.
Jaeger is an open-source distributed tracing system. It's good for learning but requires significant operational work in production.
Loki is a newer log aggregation system from Grafana Labs. It's simpler than ELK and integrates well with Prometheus.
Self-hosted options give you full control but require you to manage infrastructure, scaling, retention policies, and backups.
#Managed Services
Datadog is the most comprehensive platform. It handles metrics, logs, traces, and more. It's expensive but requires minimal operational overhead.
New Relic is similar to Datadog with a different pricing model.
Grafana Cloud is a managed version of Prometheus and Loki. It's cheaper than Datadog but less comprehensive.
Honeycomb specializes in observability for microservices. It's excellent for debugging but more expensive than basic monitoring.
AWS CloudWatch, Azure Monitor, and Google Cloud Monitoring are cloud-native options if you're already in those ecosystems.
For most teams, a managed service is worth the cost. You avoid operational overhead and get better tooling for debugging.
#Common Mistakes and Pitfalls
#Collecting Too Much Data
Every metric, log, and trace you collect costs money to store and query. Teams often instrument everything, then get hit with massive bills.
Be intentional about what you collect. Start with the metrics that matter for your business: request rate, latency, error rate, and key business metrics. Add more as you identify gaps.
For logs, don't log everything. Log errors, important state changes, and business events. Don't log every variable assignment or function call.
For traces, sample aggressively. Store 100% of errors and slow requests, but only 1% of normal requests. This gives you visibility into problems without breaking your budget.
#Not Using Dimensions
A metric without dimensions is almost useless. "Request latency: 150ms" tells you nothing. "Request latency by service: payment-api 450ms, fraud-api 200ms, database 50ms" tells you exactly where the problem is.
Always include relevant dimensions: service name, endpoint, status code, user tier, region, etc.
#Ignoring Cardinality Explosions
High-cardinality dimensions (dimensions with many unique values) can destroy your metrics system. If you include user ID as a dimension, you'll have millions of unique metric combinations. This causes storage and query performance problems.
Use high-cardinality data in logs and traces, not metrics. Use low-cardinality dimensions in metrics: service name, endpoint, status code, region.
#Not Correlating Data
Logs, metrics, and traces are most powerful when correlated. Every log entry should include a request ID. Every metric should be tagged with the service that emitted it. Every trace should include relevant business context.
Without correlation, you're looking at three separate data sources instead of one unified view of your system.
#Setting Alerts on Metrics Alone
Alerts based on metrics are often noisy. A 5% increase in CPU might be normal. A 10% increase in error rate might be a single user with a bad network connection.
Use metrics for dashboards and investigation. Use traces and logs for alerting. Alert on business outcomes: "Payment processing failed" or "User signup failed." These are more meaningful than "CPU > 80%."
#Best Practices for Production Observability
#Instrument Early
Don't add observability after you've built your system. Instrument as you build. It's much easier to add metrics, logs, and traces during development than to retrofit them later.
Use libraries and frameworks that have built-in observability support. Most modern frameworks (FastAPI, Express, Spring Boot) have middleware for metrics and tracing.
#Use Consistent Naming
Establish naming conventions for metrics, log fields, and span names. This makes it easier to query and correlate data.
Example conventions:
- Metrics:
{service}_{operation}_{unit}(e.g.,payment_api_request_duration_seconds) - Log fields:
snake_case(e.g.,user_id,request_id,error_message) - Spans:
{service}.{operation}(e.g.,payment-api.process-payment)
#Monitor Your Observability
Your observability system itself needs to be monitored. If your metrics system is down, you're blind. If your trace sampling is too aggressive, you'll miss important data.
Monitor:
- Metrics ingestion rate and latency
- Log ingestion rate and latency
- Trace sampling rate
- Query latency
- Storage usage and costs
#Use Observability for Capacity Planning
Your observability data tells you how your system is actually used. Use this data to plan capacity, identify bottlenecks, and optimize performance.
Example: If traces show that 80% of request time is spent in the fraud detection service, that's where you should focus optimization efforts.
#Build Runbooks Around Observability
When an alert fires, your runbook should tell you how to investigate using your observability tools. Example:
Alert: High error rate in payment-api

Investigation steps:
1. Check error rate by endpoint: SELECT error_rate BY endpoint
2. Check error rate by status code: SELECT error_rate BY status_code
3. Look at recent errors: SELECT * FROM logs WHERE service=payment-api AND level=ERROR
4. Check traces for slow requests: SELECT traces WHERE duration > 1s
5. Check if a specific service is failing: SELECT error_rate BY downstream_service#When NOT to Use Observability
Observability isn't free. It costs money, requires operational overhead, and adds complexity. For simple systems, monitoring might be enough.
Use monitoring if:
- Your system is a monolith with few moving parts
- You have predictable failure modes
- You have a small team
- You're cost-constrained
Use observability if:
- You have microservices or distributed systems
- You need to debug complex issues quickly
- You have a large team
- Downtime is expensive
Most production systems should use observability. The cost of debugging a production issue without good observability usually exceeds the cost of the observability platform.
#Conclusion
Monitoring tells you what you already know to look for. Observability lets you ask any question about your system. In distributed systems, observability is essential.
Start by instrumenting your code with metrics, structured logs, and distributed traces. Choose a platform (managed or self-hosted) that fits your needs and budget. Build dashboards and alerts around business outcomes, not just infrastructure metrics.
The goal isn't to collect all the data—it's to collect enough data that you can debug any production issue without guessing. When something goes wrong, you should be able to answer "what happened?" in minutes, not hours.
That's observability.