#Project Overview
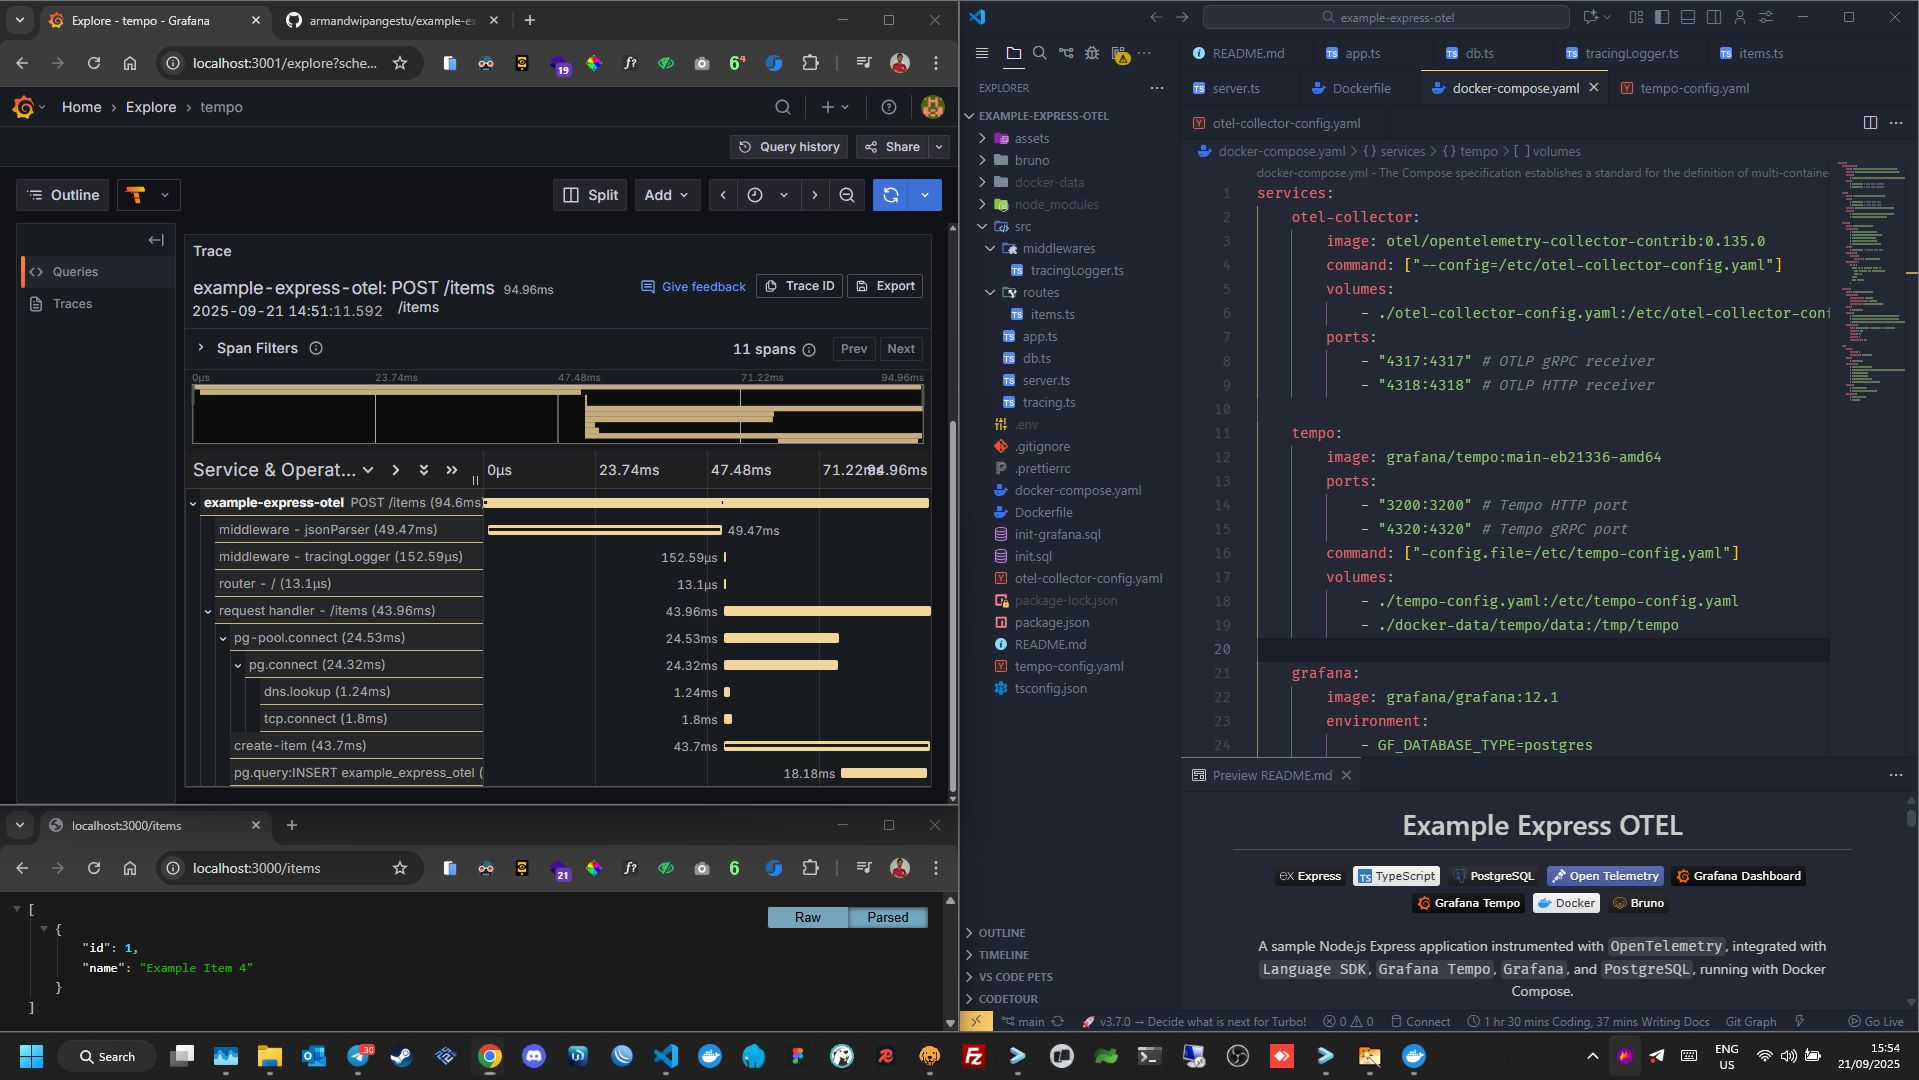
Express Open Telemetry is a sample Node.js (Express) application instrumented with OpenTelemetry to demonstrate distributed tracing in a modern backend system. The project integrates OpenTelemetry SDK, Grafana Tempo, Grafana, and PostgreSQL, all running in a Docker Compose environment.
This project focuses on observability, specifically distributed tracing, which is one of the three core pillars of observability:
- Metrics
- Logs
- Traces
#Background & Motivation
This project was created out of my curiosity about modern observability practices, especially how distributed tracing works in real-world backend systems.
Prior to this project, I had hands-on experience implementing the other two observability pillars:
#Metrics
-
Used various exporters (Node, MySQL, PostgreSQL, etc.)
-
Prometheus as the metrics server
-
Researched and implemented Thanos for:
- Prometheus clustering
- High availability (HA)
- Load balancing across Prometheus instances
- Long-term storage using an S3-compatible backend (MinIO)
#Logs
- Used Grafana Alloy as the agent
- Centralized logging with Grafana Loki
- Implemented a remote write mechanism to a centralized log server
However, I had not yet explored trace-based observability in depth. This led to a key question:
How does distributed tracing work end-to-end, from application instrumentation to trace visualization in Grafana?
#Problem Statement
Through this project, I aimed to understand:
- How OpenTelemetry instrumentation works in an Express.js application
- How trace data is collected from the application
- How traces are sent from the agent to the tracing backend
- How Trace IDs are generated and propagated across requests
- How to query traces using TraceQL in Grafana Tempo
- How distributed tracing helps with performance analysis and debugging
#Solution Approach
To answer these questions, I built an end-to-end distributed tracing pipeline with the following approach:
#1. Application Instrumentation
-
Instrumented an Express.js application using the OpenTelemetry SDK
-
Enabled manual instrumentation for:
- HTTP requests
- PostgreSQL database queries
-
Manual trace context propagation across requests
#2. Tracing Backend
- Used Grafana Tempo as the tracing backend
- Responsible for receiving, storing, and managing trace data
- Supports flexible trace querying using TraceQL
#3. Visualization & Analysis
-
Grafana serves as the primary visualization layer
-
Traces can be:
- Searched by Trace ID
- Filtered and analyzed using TraceQL
- Visualized to inspect request flow, latency, and service dependencies
#4. Local Development Environment
- All services are orchestrated using Docker Compose
- Enables easy local setup, testing, and experimentation with distributed tracing
#What I Learned
From this project, I gained practical insights into:
-
The fundamentals of distributed tracing
-
How OpenTelemetry works as a vendor-neutral observability standard
-
The complete tracing data flow:
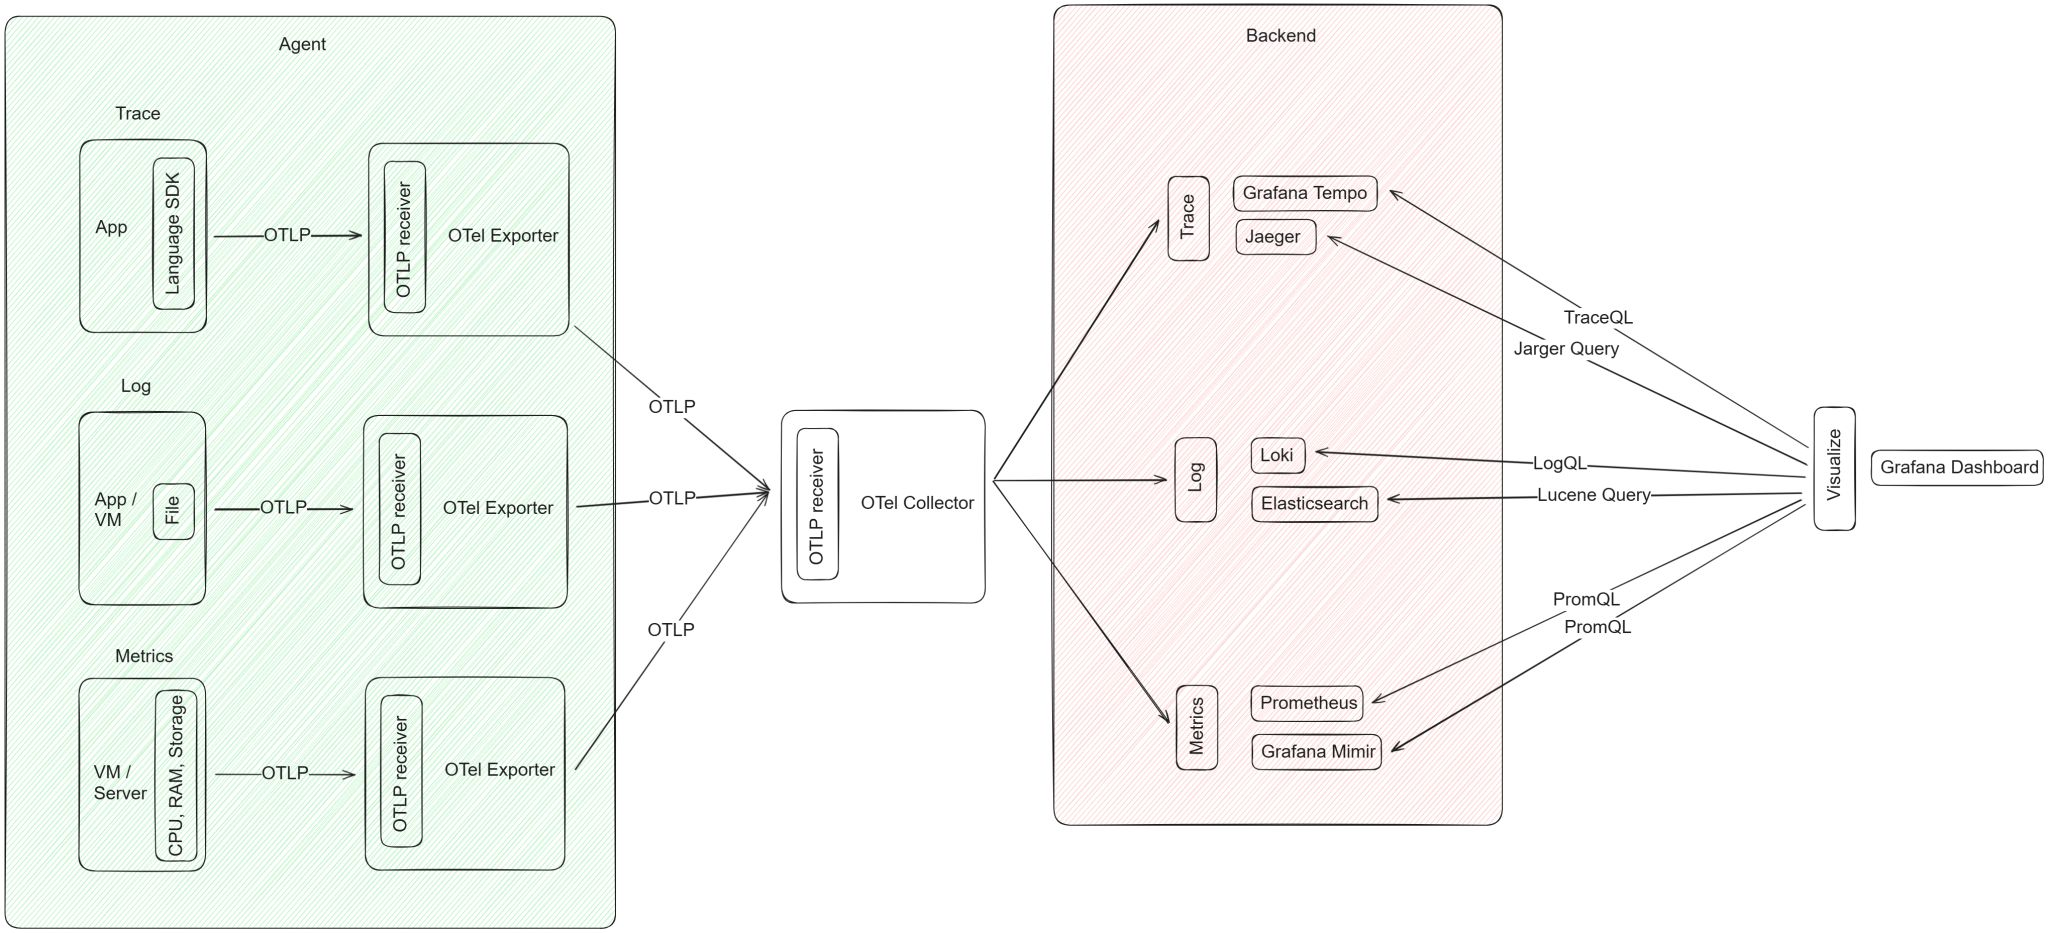 Observability Flow
 -
The role of tracing in:
- Debugging latency issues
- Identifying performance bottlenecks
- Understanding request flow across services
-
Using TraceQL for efficient trace querying and analysis
#Why This Project Matters
This project is not just a sample implementation, but a practical exploration of distributed tracing in a backend system.
With distributed tracing:
- Debugging goes beyond simple log inspection
- Root cause analysis becomes faster and more accurate
- Inter-service dependencies are clearly visualized
#Conclusion
Express Open Telemetry represents my hands-on exploration of distributed tracing and modern observability tooling. It completes my understanding of the three pillars of observability and strengthens my skill set in Backend Engineering, DevOps, and SRE practices.